airline-safety-assesment
The case study was done to assess the safety of airlines based on its track record, using the airline safety data hosted by FiveThirtyEight, which provides the safety records of major commercial airlines, over a span of 30 years.
View the Project on GitHub rchadha96/airline-safety-assesment
Airline Safety Assesment
Project Goal: To Assess Airline Safety and generate Risk Score based on track record using R
Introduction
The case study was done to assess the safety of airlines based on its track record, using the airline safety data hosted by FiveThirtyEight, which provides the safety records of major commercial airlines, over a span of 30 years. The context of this analysis is the outcome of certain academic studies that high-profile crashes can shift passenger demand away from the airlines involved in the disasters.
The dataset divides the 30-year period into two halves and gives information about the number of crashes, fatal accidents and fatalities occurred over these years along with available seat kilometers (ASKs) of 56 different airlines.
The prime objective of the case study was to check whether there was a relation between the crash rates of first time period and that of the second which would imply that the risk is persistent and is predictable based on its crash history.
Analysis
Data Standardization:
Based on the dataset obtained we have categorized the airline into private and government airlines.
  air <- read_csv("AirlineSafety-SAS.csv")
  # Adding Type of airline.
  air <- air %>%
  mutate(type=ifelse(grepl("*", airline, fixed = TRUE),"Government","Private"))
Data Visualization:
In-order to find the correlation of crash rate from one period to the next a scatterplot matrix was produced. The three variables: incident, fatal_accidents, fatalities are compared between two periods and how the distribution changes for the Government-owned and private-owned airlines.
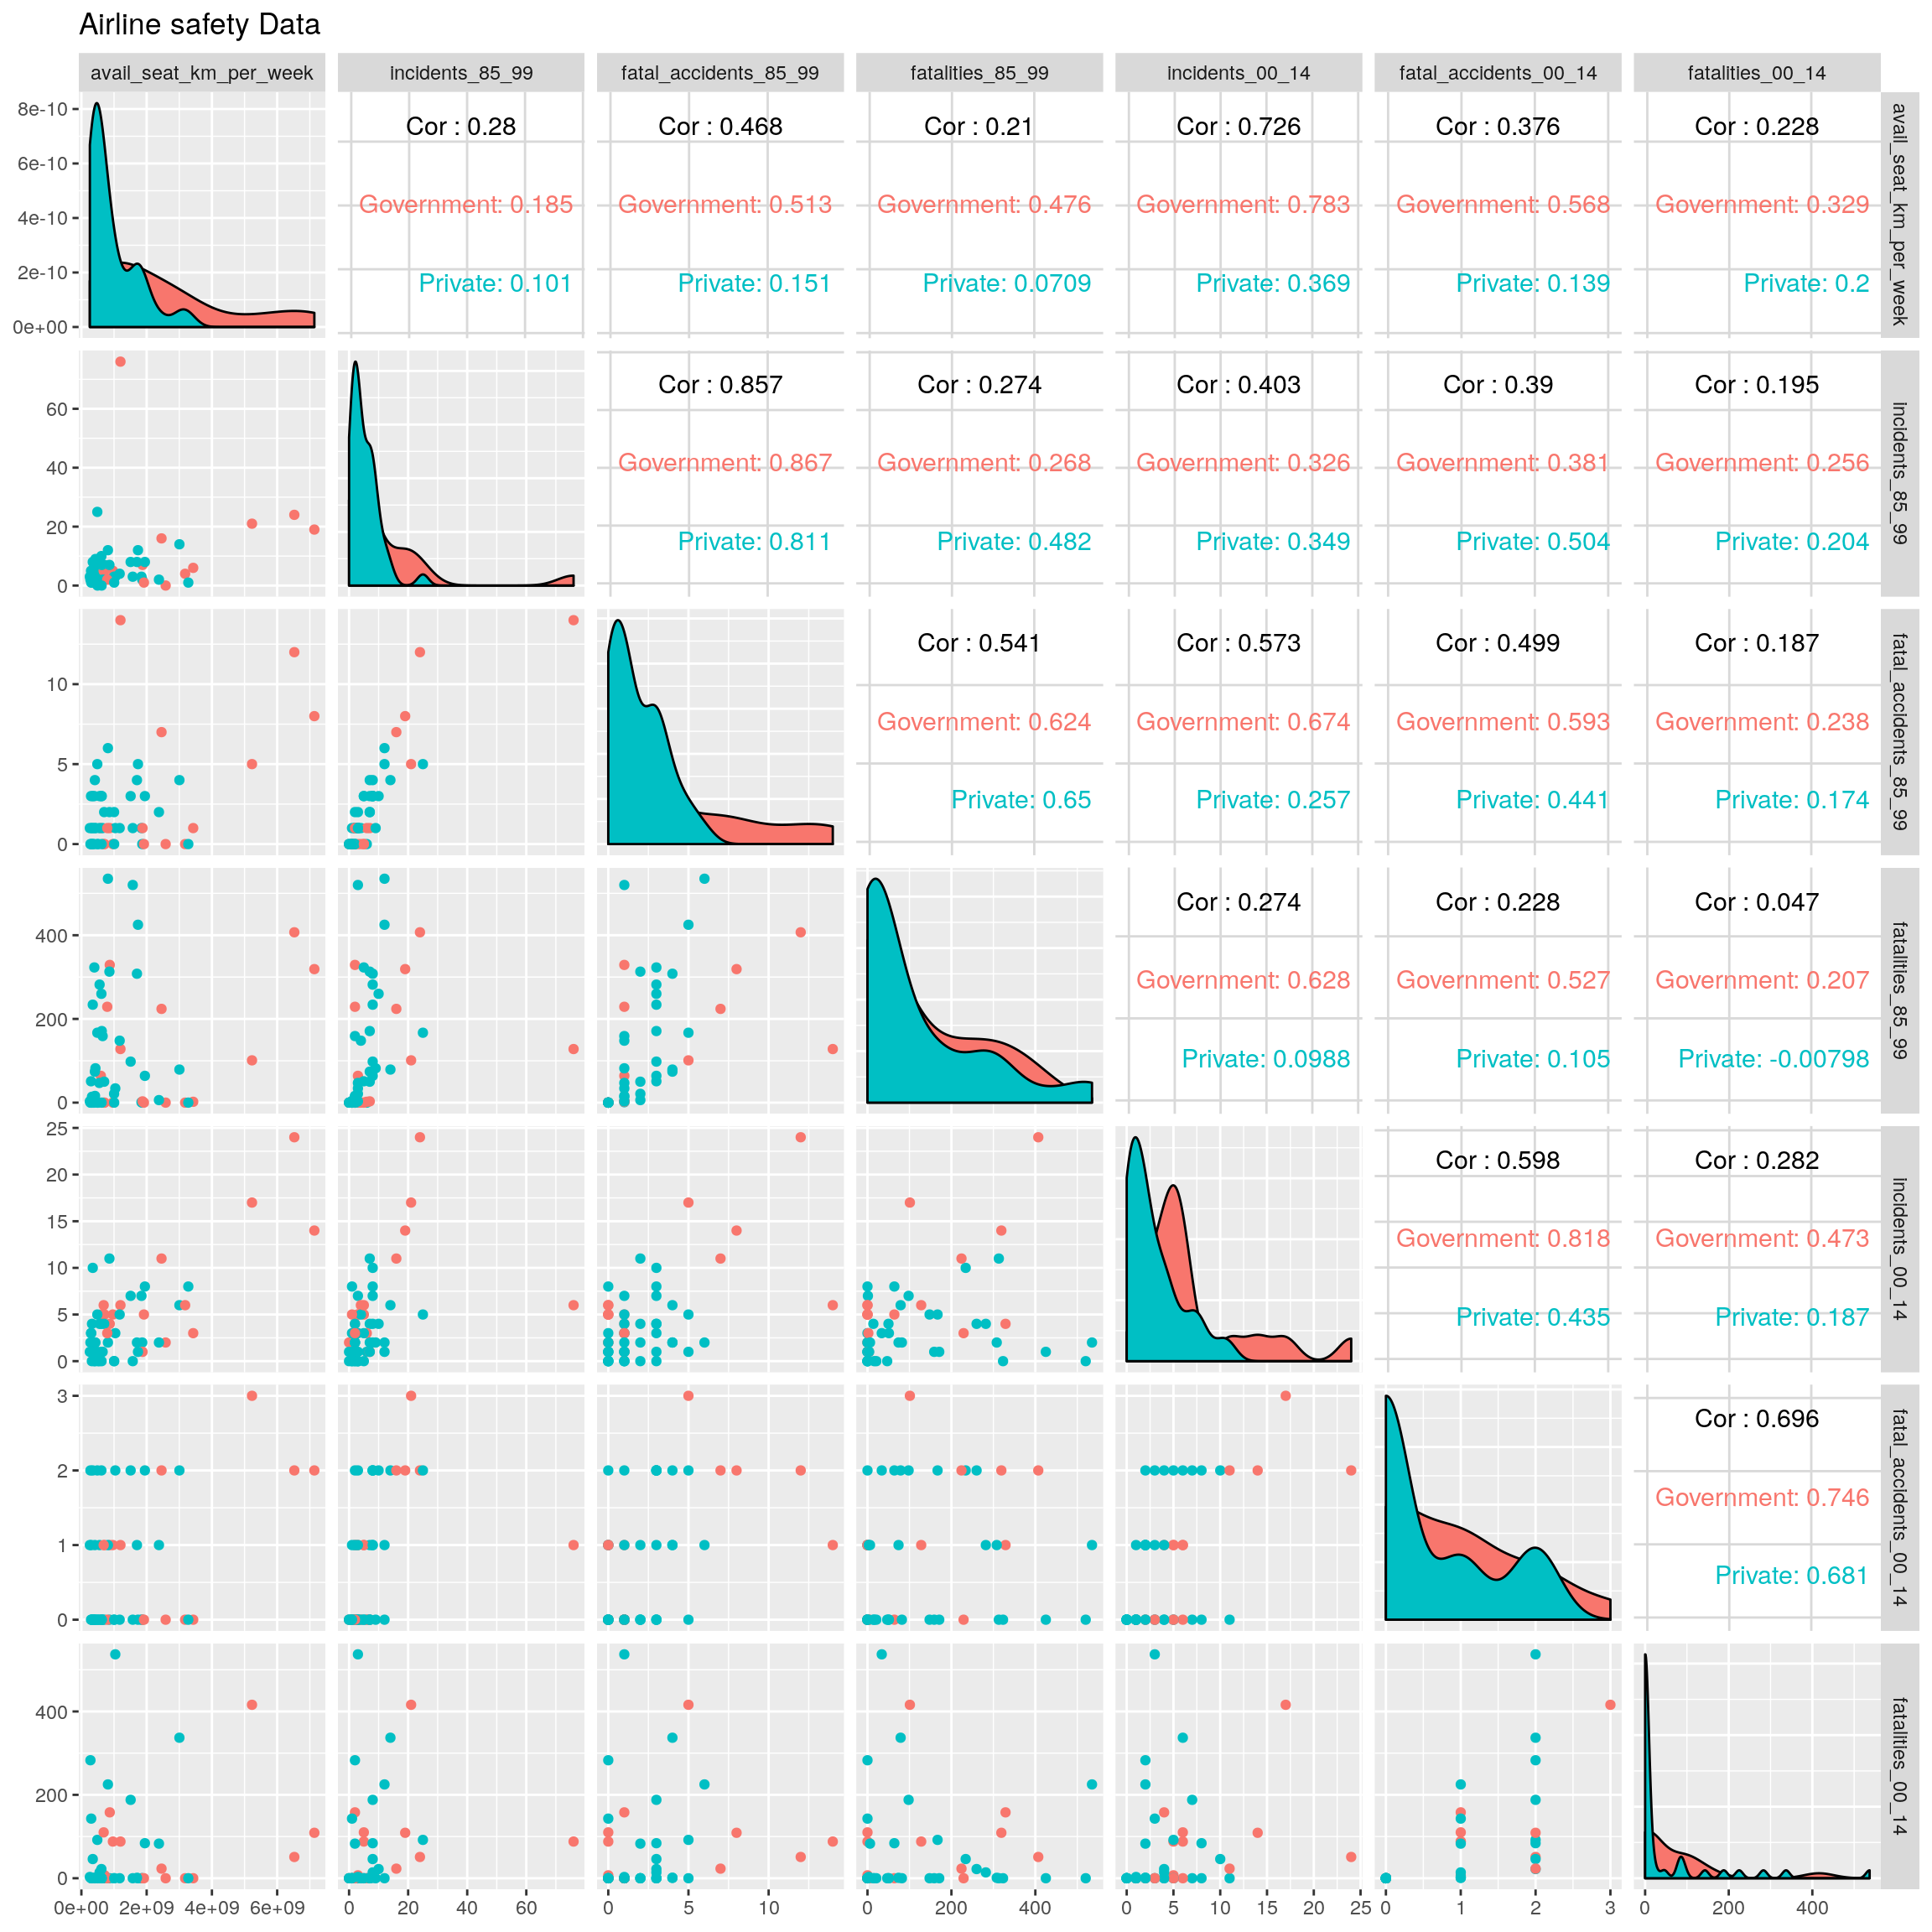
Overall, there is no relation between fatalities from one period to another but incidents ae slightly correlated.
To gain detailed inferences about the data and the relationship among the variables, the following visualizations were produced:
The scatterplot below shows the incidents which resulted into fatal accidents for both the periods and the distribution of that between government and private owned airlines.
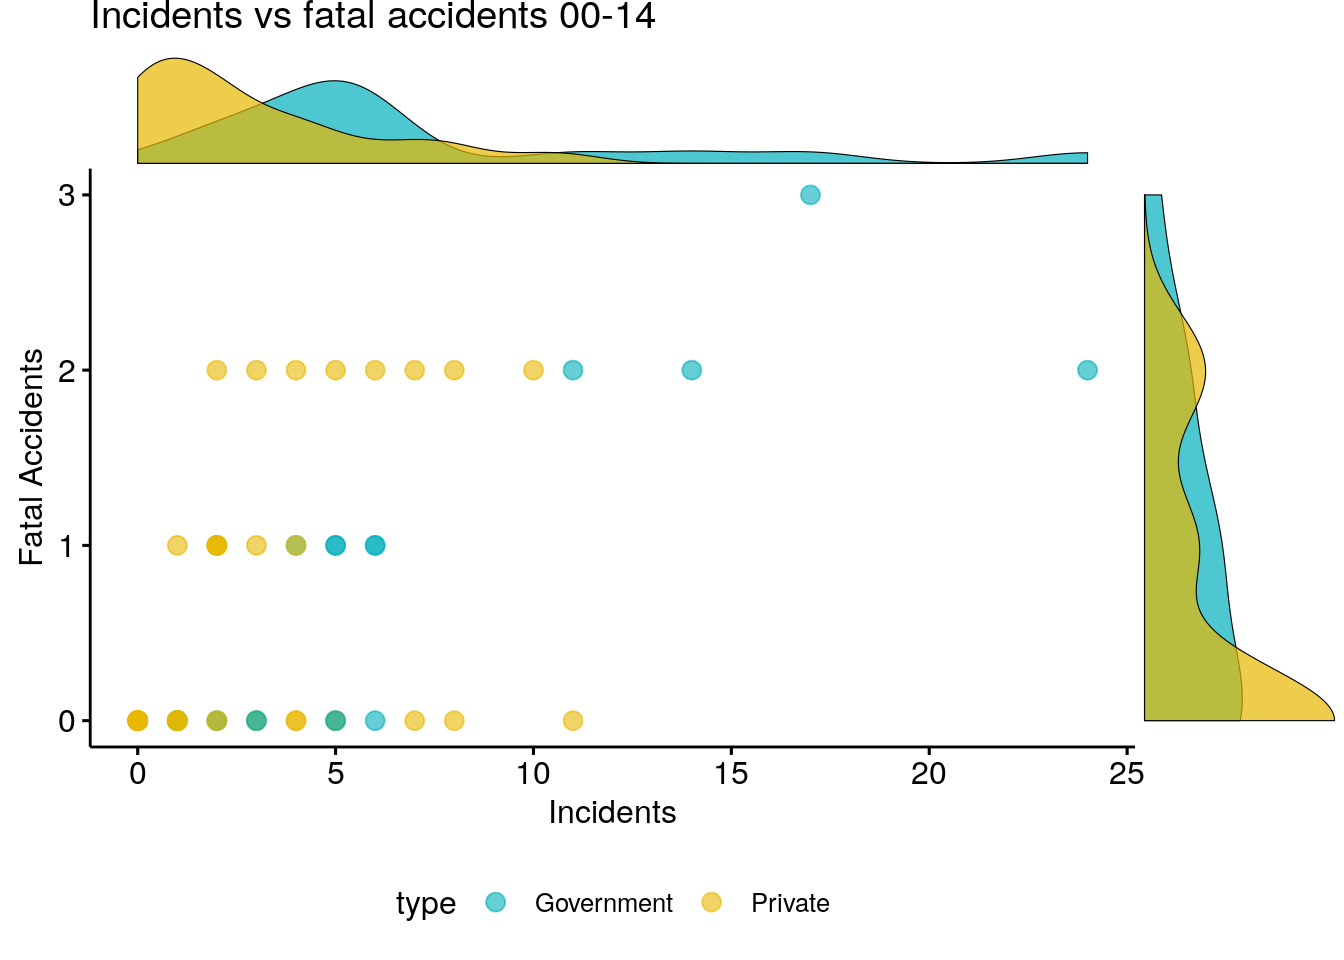
The above plots show that nationalized airlines tend to have more number crashes both in terms of incidents and fatal accidents and during both periods.
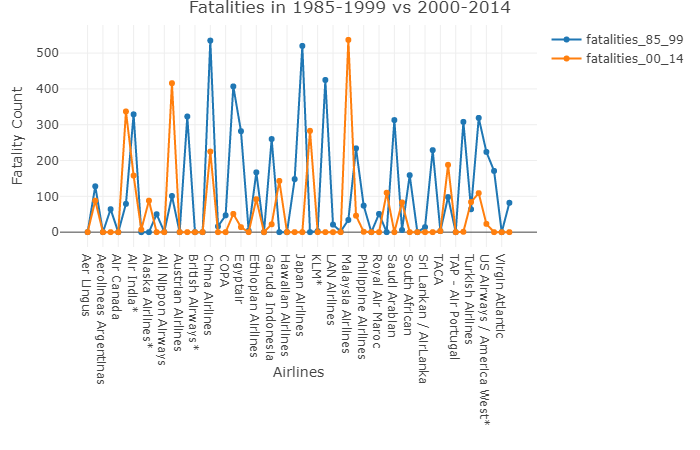
The above plot shows the distribution of fatalities over the two period. There are some airlines which contradicts our theory Eg: Malaysian Airlines which had a pretty good track record in the first period doomed to the most dangerous airline by the end of the second period whereas Japan Airlines which was apparently the most risky airlines in the first half improved significantly in the second period with 0 fatalities.
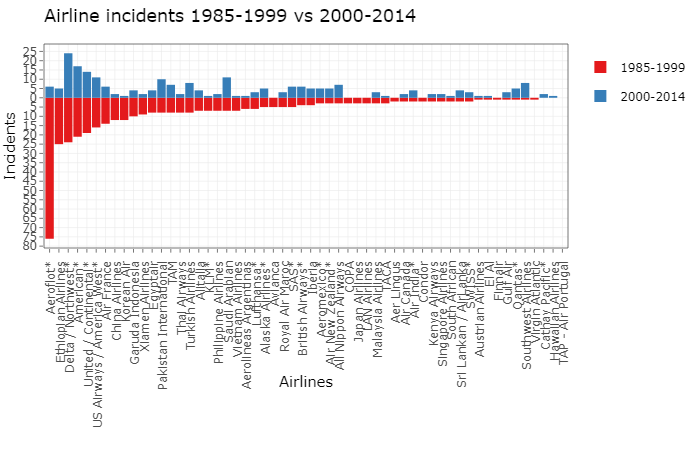
The distribution of incidents over the two time periods concur with our theory to an extent. Most of the airlines which had a good track record in terms of the number of incidents show the same trend in the second time period as well with few exceptions like Aeroflot.
Data Analysis and modelling:
K-Means Clustering
To find groups within the data based on the available features we used K-means clustering algorithm. The data was divided into 8 clusters based on feature similarity.
km<-kmeans(airline2,8,nstart = 10)
clusk<-km$cluster
o <- order(clusk)

stars(airline2[o,],nrow=9,ncol=12, col.stars=clusk[o]+1,frame.plot = TRUE,cex = .5)
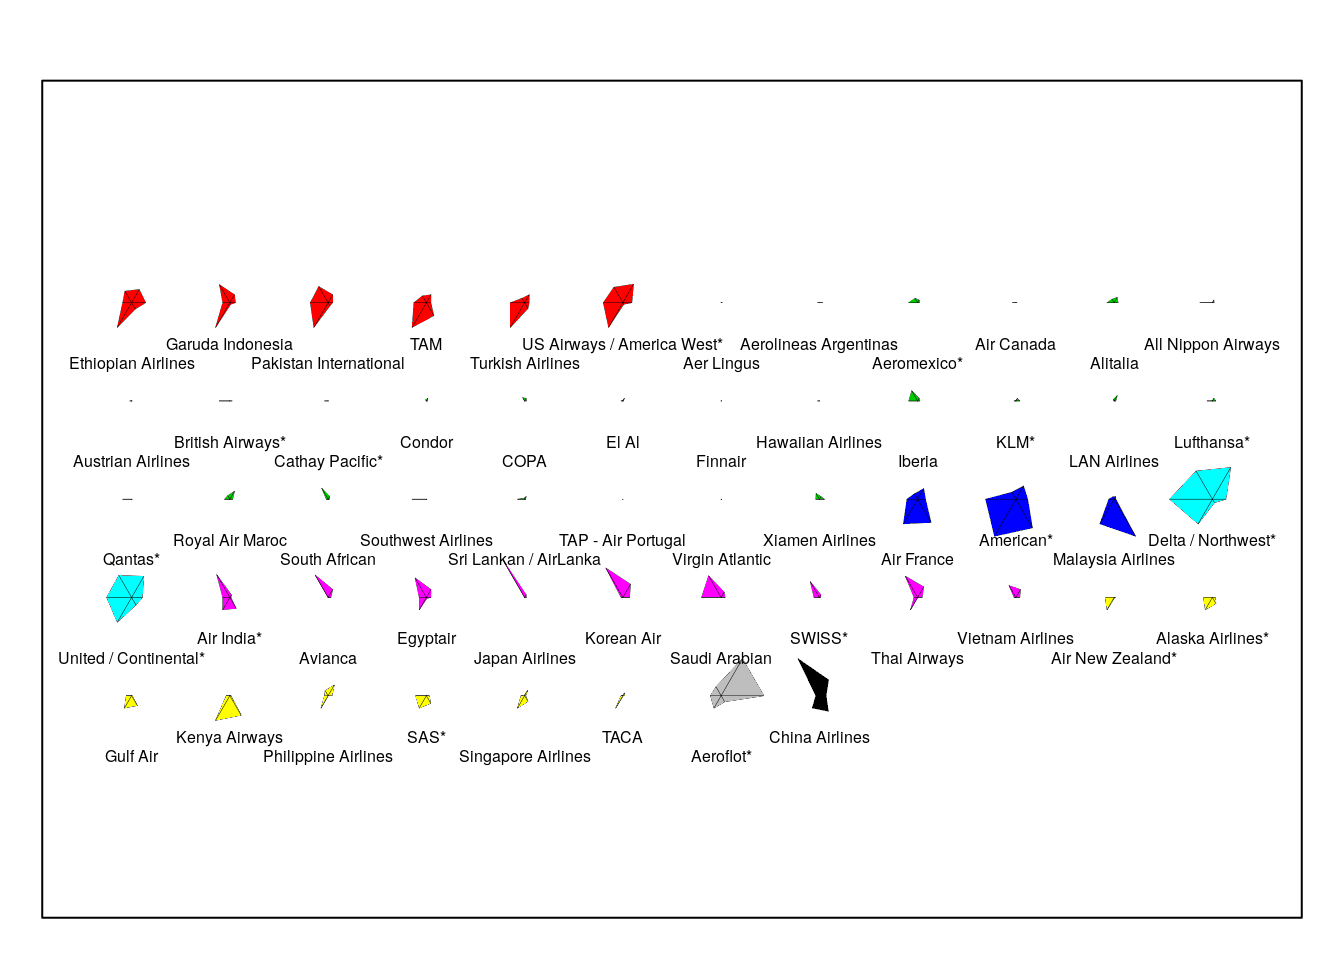
- Cluster 1: Airlines which have Highest Fatal Accidents among all the airlines (excluding American airlines) in Phase 2, with the number of fatalities significantly reduced in Phase 2, when compared to Phase 1.
- Cluster 2: Airlines with significant number of Incidents and Fatalities in Phase 1, with incidents and fatalities highly reduced (nearly zero) in Phase 2.
- Cluster 3: Airlines with highest fatality rates in Phase 2. Probably had met with huge accidents and hence one of the most dangerous groups.
- Cluster 4: Airlines with high fatality rates in Phase 1, which significantly reduced in Phase 2. (These airlines can be trusted, as they have probably ensured to take safety measures and improve their overall flight safety).
- Cluster 5: Airlines with all the incident, fatal accidents and fatality rates reduced in phase 2 from Phase 1. Supposedly the safest group.
- Cluster 6: Airlines with very low incident rates in Phase 1 but have significantly higher rates in Phase 2. (except for Philippines airlines, which seems to be an outlier for the group where the accident rates have reduced).
- Cluster 7: Aeroflot: Highest number of accidents in Phase 1. Have improved in their safety in Phase 2. Seems to have improved.
- Cluster 8: China airlines has the number of highest fatalities over the period of 1985 to 1999
Risk Score Calculation:
To quantitatively measure the risk of airlines and compare between we calculated a risk score by combining the 3 variables after scaling and giving appropriate weightages. The score for both periods was then combined to generate an overall score. The score was calculated through the following steps:
- Calculating Harmless_Incidents: Incidents-Fatal Accidents
- Standardizing Harmless_Incidents, Fatal_Accidents and Fatalities
- Degree of harmfulness can be determined in the order: Fatalities > Fatal_Accidents > Harmless_Incident. So providing following weights to the columns:
- Harmless_Incidents-25%
- Fatal_Accidents-35%
- Fatalities - 40%
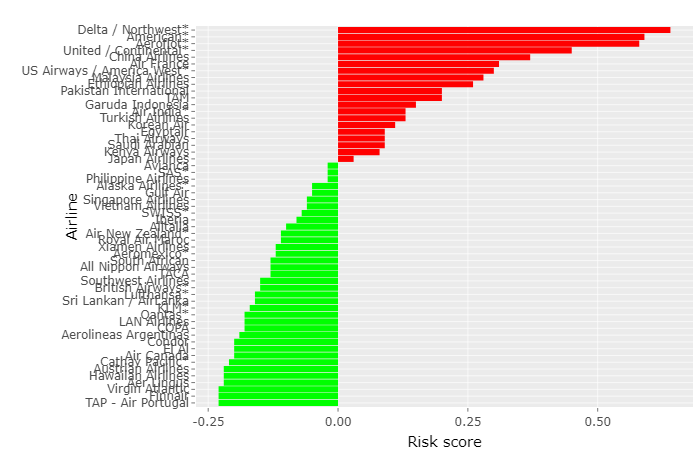
- Calculating Risk Score : avg(Harmless_Incidents, Fatal_Accidents , Fatalities) Positive Risk Score indicate a bad track record meaning the airline is unsafe and negative Risk score tells that the airline is relatively safe.
Conclusion
Based on the analysis done it can be said that Private airlines are much safer than Government owned airlines. Malaysian Airlines which had a pretty good track record but ended up to be a most dangerous airline by the end of the second period. Whereas, Japan Airlines which was apparently the riskiest airlines in the first half improved significantly in the second period with no fatalities.
From Risk score generated we can say that TAP-Air Portugal is the safest airline, while the Delta/Northwest airlines is most un-safe airline.
Finally, for further precise conclusion over “Which Airlines is the safest to travel?” we have to take into account on other useful details like Total Passengers travelled, Number of Journey, Total Journey Hours, Type of accident (i.e. Human Error, Mechanical, Terrorist, etc.), Airplane type (i.e. Jumbo, mid-size, small, etc.) and Service Status of the Airlines (i.e. Active, Shutdown).